In order to create a new burndown chart, click on the drop down arrow beneath the ‘New Chart’ option on the toolbar. To create the parameters for a new or existing chart, select the ‘Chart Parameters’ option on the toolbar.
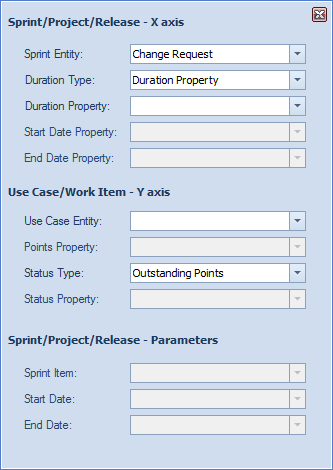
X axis: Select an entity and its date properties that will form the x axis of the chart.
Y axis: Select an entity and its numeric property representing the total points awarded to this instance that will form the y axis of the chart. Then define a second property to represent the completion state of the item. The Calculated Column property type on an extended entity cannot be used on the y axis, however a Child Count or Related Entity Count property can be used.
Sprint Item: The item that will be represented in the burndown chart.
Start/End Date: These dates are by default populated from the Sprint property above and form the basis of the x axis, however they can be manipulated here.
Please note that data from both extended and external entities can be used in the burndown chart.
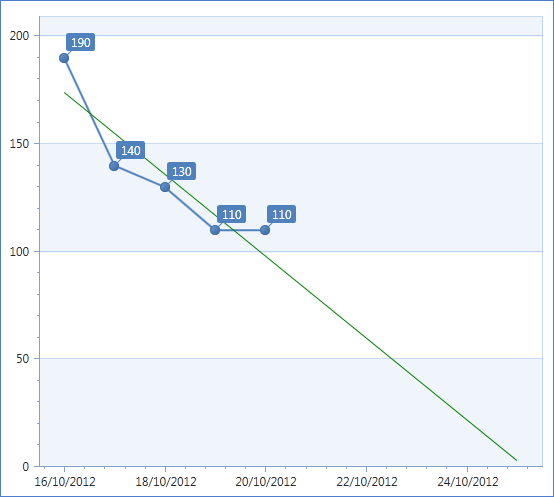
The expected completion date of the selected Sprint is shown by the green line on the chart above. If the data on the chart does not enable an accurate forecast, a message is displayed.