The chart designer allows you to create and customize a chart of any level of complexity from scratch with a report.
In the Toolbox under the Standard Control area, you can drop and drop the Chart Designer onto the report to bring up the Chart Designer.

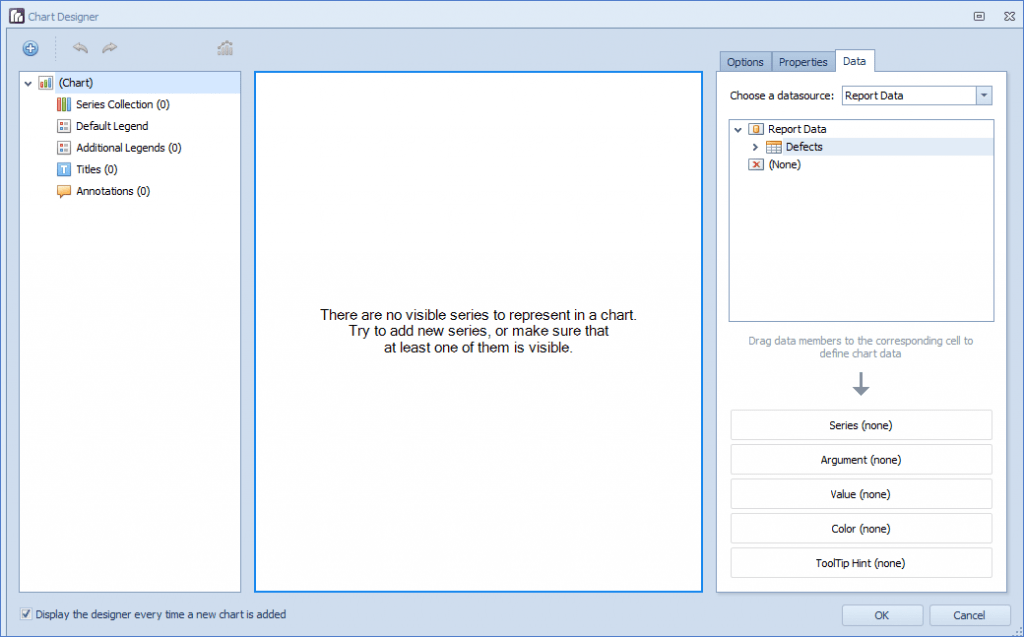
The Chart wizard will now display. Click on the Data tab and expand the entity in the Report Data. In this example, Defects.
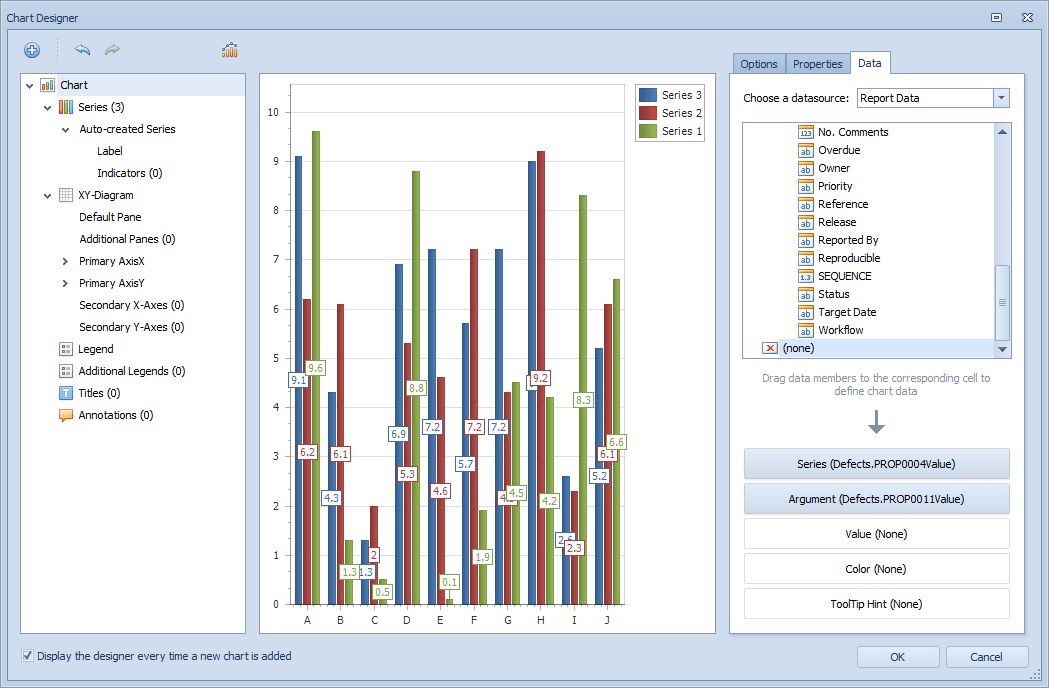
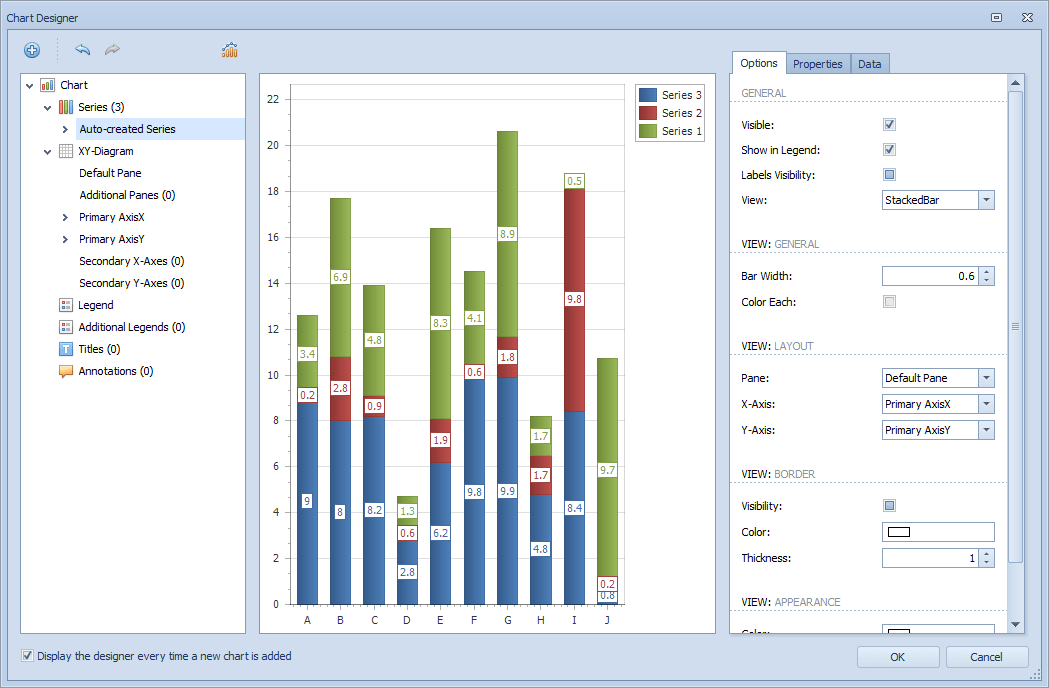
Drag the pivot columns onto the Series and Argument fields. In this example, the Status goes into the Series and the Assigned To goes into the Argument. This creates the “Auto-created series” as shown below.
Change to the Options tab and change the View Type as needed. In this example, Stacked Bar.
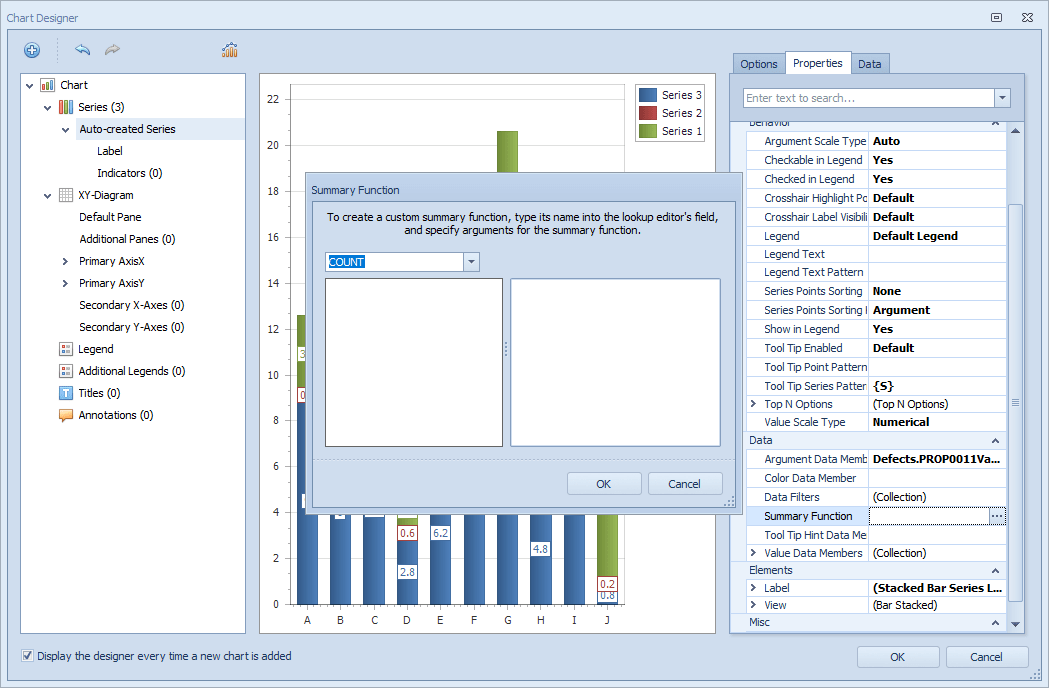
In the Properties tab, change the SummaryFunction to Count.
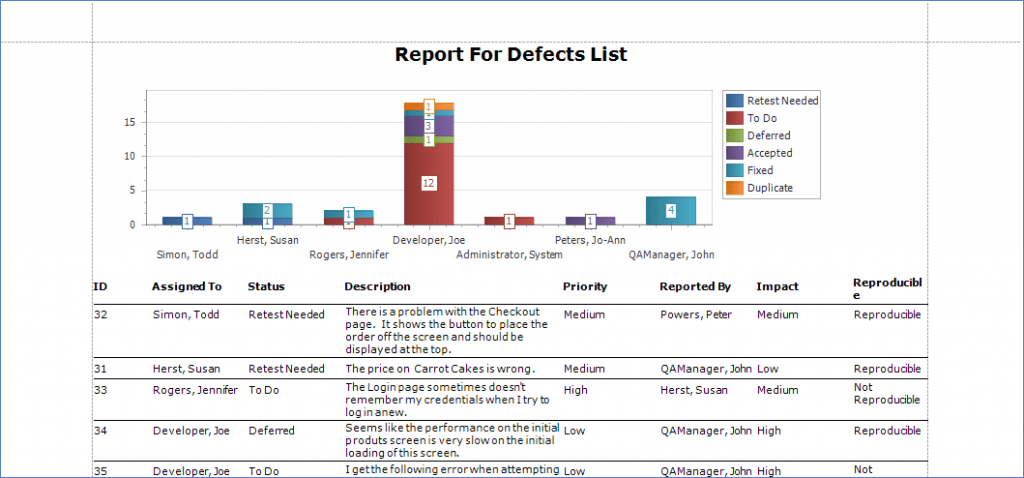
After completing all of the example steps, click the OK button to close the chart designer and resize accordingly with your report. In the example below, your output should have a similar look.