This type of checking rule enables the underlying hardware and its potential impact on the application (and vice versa) to also be tested. Hardware monitoring allows almost thirty performance related metrics to be analysed and their results stored with the rest of the test results. For example, the percentage of the total processor time used by the application under test at any given point can help to identify areas which are causing a processor bottleneck.
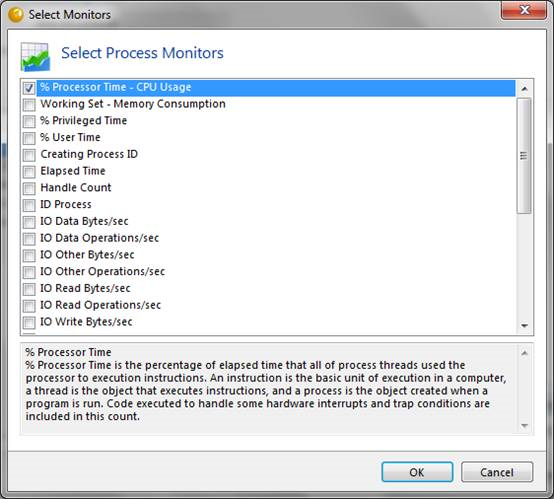
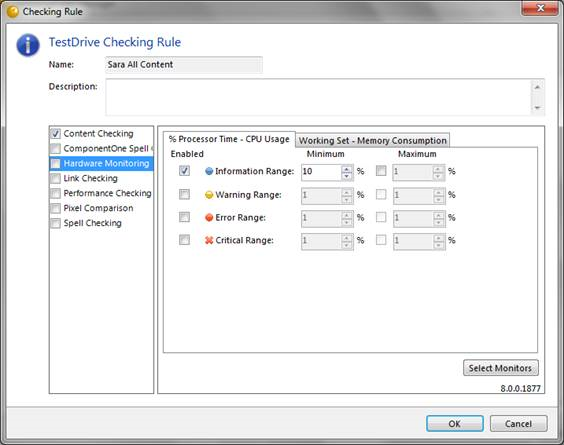
Click on the ‘Select Monitors’ button when the Hardware Monitoring option is in focus to display the following screen from where the metrics to be monitored can be selected.

Once selections have been made, specify the thresholds which will cause a checkng rule failure.

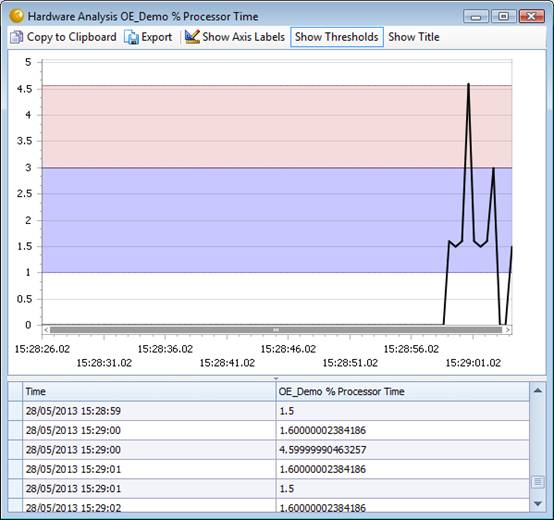
Hardware monitor check results are displayed using a graph similar to the following.

