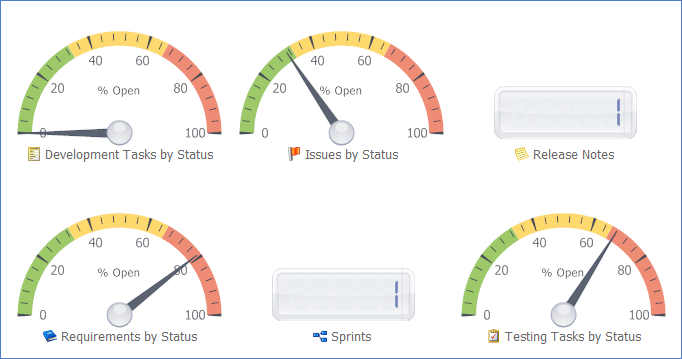
The Application Dashboard can be opened at any time by clicking on it within the Application Options area in the left hand panel. If a single select pick list exists on the entity which has been fully defined with open and closed statuses, then the speed dial monitor is used, otherwise a simple count is displayed.
Hover over an entity to expand it in the left-hand panel, click on an entity to display all Open items in the default grid view. Right click any entity to Add a new item.
Further detailed dashboard statistics for a given entity can be opened by clicking on the top most option when the entity is expanded in the left hand panel.
Click Refresh on the toolbar at any time to update the item counts.