Columns: By default, every property on the entity definition will appear as one column on the grid. The only exceptions are Milestone properties, which will have two entries in the grid, the milestone text and the target date, and Durations which have a Start Date, End Date and Elapsed Days. For every top level entity, columns can be added to any grid to display a count of any or all of their child entities. For example, a Testing Task has child tabs containing Comments, Steps, Attachments and TestBench Components. It also has a top level child called Issues. Whether or not counts of these items are available is controlled within the Administration area. Additionally, many other calculated and related data can be displayed, this is all explained in the Administration help file.
Displaying every property is unlikely to be the desired result as commonly only the most important fields should appear when viewing a list of entities in grid format. Therefore, there are several ways to manipulate the columns on the grid.
To quickly remove a column from the view, you can click the column header and drag it downwards until a black ‘X’ appears, then let the mouse go.
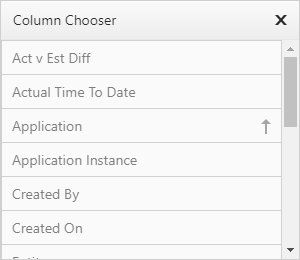
To add a column back into the view, select the ‘Columns’ option from the toolbar. This will display a small window containing all of the properties for the entity including those that do not appear on the current view. Tick a property to add it to the view and use drag and drop in the left most column to change the sequence of the properties. The main entity caption that appears on the Preview panel and in the grid preview row can be changed using the selection list at the top of the window.
Column Widths: Click and drag the column separators to create your desired column widths, these will get remembered when the view is saved. There are also two options on the right click menu (right click in the column header area). Click a column and choose ‘Best Fit’ to select the optimum width for the column based on its column title and data (although in the Administration area no data is displayed so this is done based on column title only). Alternatively click on the ‘Best Fit (all columns) option to do the same for all columns in the view.
Sorting: Click on a column header to sort that column in ascending or descending sequence. Please note that for Pick Lists, unless the option to use alphabetical sorting has been switched on in Admin, the sorting is not alphabetical but the sequence in which the values are keyed on the Pick List screen. To sort by more than one column, hold down the Shift key.
To remove all sorting that you have defined for this view, click in the column title area and select the ‘Clear Sort’ option.
Options – Show Preview Row: Access this from the Options toolbar button. The column which is marked in the Column chooser as the Caption property (typically the main item identifier such as Defect Description) will be displayed in a preview area beneath each item.
Options – Show Multiline Text: For basic text properties, use more than a single row to display the value, up to a maximum of 200 characters.
For numeric properties, it is possible to add up all values in the grid and display the total, display the lowest or highest value and also display the average of all values. For all property types the number of rows in the grid can be counted.
All Children: Access this from the Options toolbar button for hierarchical entities only. Using Requirements as an example, this option determines if, when viewing Testing Tasks from a Requirement, the Tasks for its sub-requirements are also visible.
Options – Allow Horizontal Scrolling: By default, all columns will be proportionally re-sized to fit the width of your display. However, this option is particularly useful for grids where there are many visible columns and not enough horizontal space to see their data in a meaningful way.
Exporting: Any view can be exported to CSV, XLS, XLSX or HTML files by clicking the Save / Export option.
Expand All Groups: Expand or collapse all groupings to show all data rows within.